Educational only. Not investment advice.
Free sample issue · Week of Oct 12, 2026
27 days of Greed. $655 million walked out anyway.
The mood gauge has read Greed for 27 days straight. Over the same stretch, US spot bitcoin ETFs saw $655 million in net outflows over five sessions, ETH lost 4% against BTC in a single week, and this morning inflation came in hotter than forecast. The mood gauge and the money flows are saying different things. Here is how to read both.
What moved this week, and why
The macro story. September CPI landed at 8:30 AM ET today: headline up 3.7% from a year ago against a 3.6% forecast, core up 2.6% against 2.5%. A tenth of a point sounds like nothing. It is not nothing when the next Fed meeting is two weeks out (Oct 27 to 28). Hotter inflation makes it harder for the Fed to ease, which keeps real yields firm, and firm real yields have often lined up with bigger swings in assets that pay no interest, like Bitcoin.
The flows story. US spot bitcoin ETFs had $654.5 million of net outflows over the five sessions from Oct 6 to Oct 12, including $729 million out on Oct 7 and 8 alone. Then $175.7 million came back in on Oct 13, and just $2.2 million on Oct 14. One inflow day after an outflow week is a data point, not a pattern. The thing to notice is that the outflow week happened while sentiment barely moved.
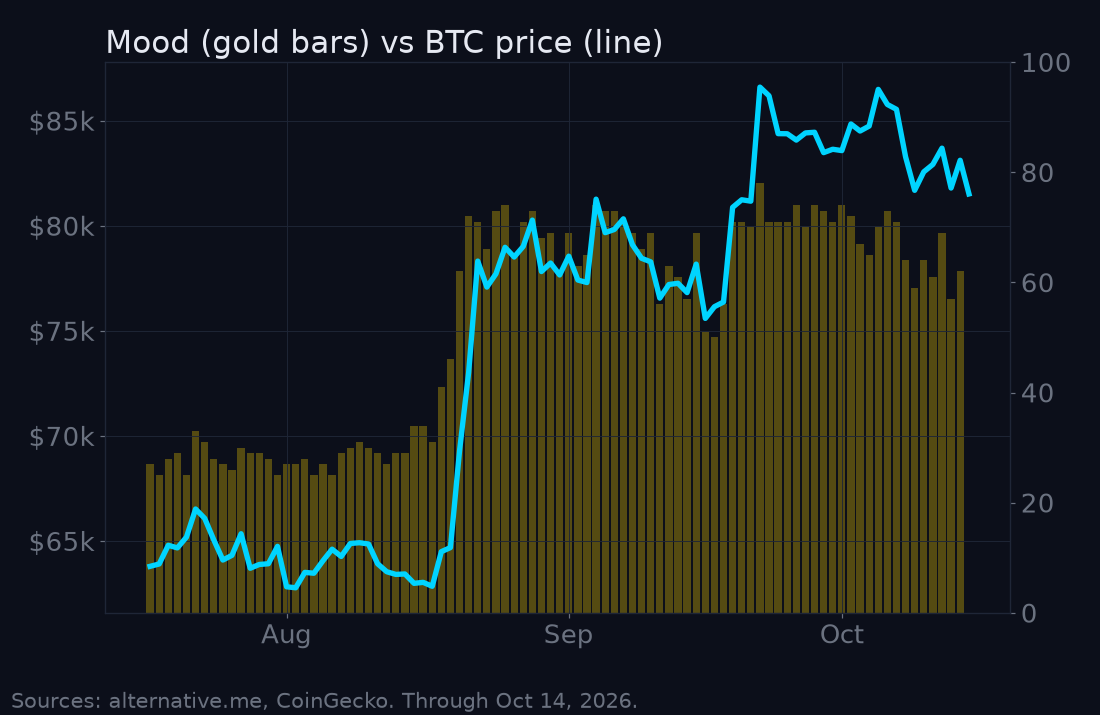
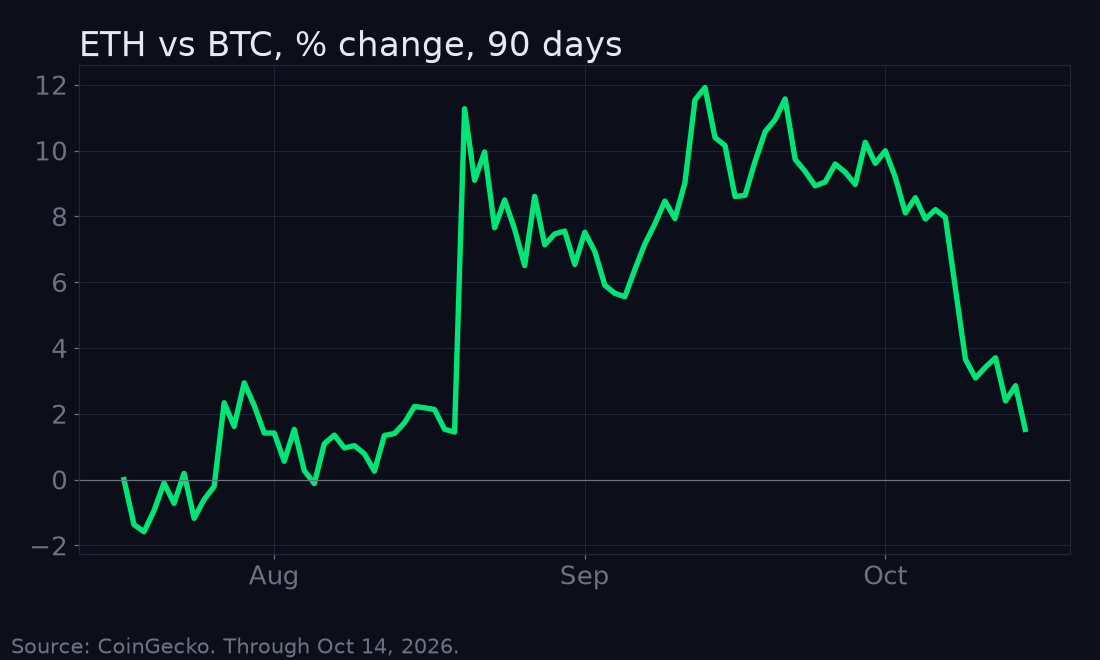
What the crowd missed. Bitcoin is about 30% above where it was on Aug 2 and 5.9% under its 90-day peak on Sept 22. That is a calm-looking chart. ETH slid 4% against BTC in one week. Here is what that ratio measures and why analysts track it.
In the members' issue, starting Issue #1
Where the coins actually went this week: exchange balances, stablecoin supply and what long-term investors did, in plain English.
Unlock the full issue, $15/moFramework: how to read a drawdown
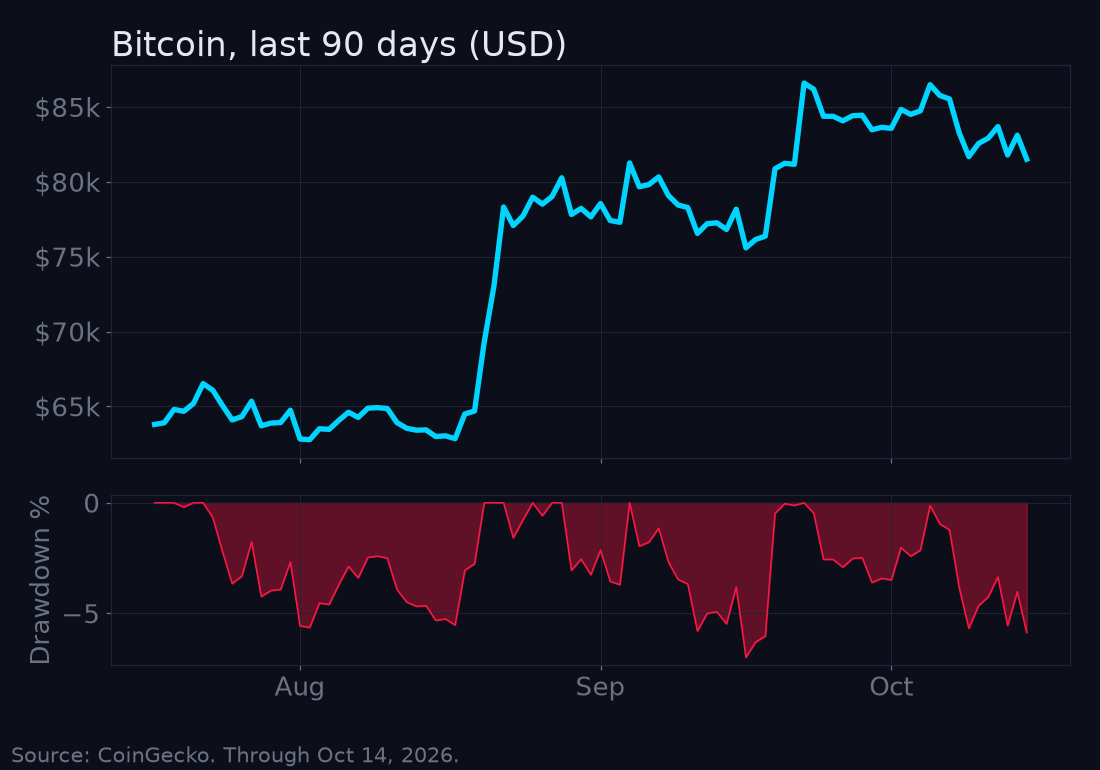
A drawdown is how far price sits below its most recent peak. It is the single most honest number in crypto, because it tells you what owning the asset actually felt like, not what the yearly return says.
Three questions we teach readers to ask every time they look at a chart like this:
- How deep is normal? Over the last 90 days the deepest pullback from a high was 7.0%, from Sept 3 to Sept 15. The Aug 2 reading sat only about 2% under the start of the window. Over Bitcoin's history, drawdowns of 70% or more have happened several times. Both are true at once.
- What regime is volatility in? 30-day annualized volatility is about 40%, close to the 90-day level of 38%. That is a middle regime. Not sleepy, not panicked.
- Does sentiment agree with the drawdown? Right now a shallow drawdown sits next to persistent Greed. When those two disagree, that is worth studying, not acting on.
In the members' issue, starting Issue #1
Which volatility regime we are in now, and the three readings that would tell you it changed.
Unlock the full issue, $15/moLesson of the week: why inflation data moves Bitcoin
Bitcoin pays no yield. When inflation surprises up, markets expect rates to stay higher for longer. That raises the "real yield" you can earn on cash and bonds after inflation, and raises the bar for anything that pays nothing. That is the chain: CPI surprise, rate expectations, real yields, the dollar, then risk assets. Today's 0.1-point surprise ran straight down that chain.
Glossary: Real yield. The return on a bond after subtracting expected inflation. Rising real yields tighten financial conditions; falling real yields loosen them. It is one of the most watched macro inputs for crypto.
What to watch next week (data, not predictions)
- Daily spot ETF flows. Does the Oct 13 inflow repeat, or was it one inflow day inside an outflow stretch?
- Fear and Greed. Does the 27-day Greed streak last if flows stay soft?
- Fed speakers ahead of the Oct 27 to 28 FOMC meeting. How officials talk about today's CPI print.
- ETH versus BTC ratio. Whether this week's 4% slide continues or stabilizes.
In the members' issue, starting Issue #1
Every release through the Oct 27 to 28 FOMC, ranked by how much it has historically moved crypto volatility.
Unlock the full issue, $15/moComing to Pro
- 🔒 Why "Greed" is not a timing tool What long Greed streaks have and have not told us
- 🔒 ETF flows explained Who is actually behind the numbers, and why one day means little
- 🔒 Halving cycles, honestly What the data supports and what is folklore
- 🔒 Stablecoin supply as a liquidity gauge The on-chain number most retail readers never check
CryptoStreet Pro
The data the crowd skips, every Monday.
Every Monday, Pro members get the full issue, including the sections previewed above as they roll out:
- The on-chain read: exchange balances, stablecoin supply, long-term investor behavior
- The volatility regime map, updated weekly
- The full macro and data calendar, explained
- One new framework and lesson each week, plus the growing archive
Free readers get the headline. Pro readers get the why.
$15 a month or $129 a year. Cancel anytime. 14-day money-back guarantee.
What you will not get: trade calls, price predictions or recommendations about any coin or token. We teach. You decide.
Educational only. Not investment advice. CryptoStreet is general market education from Webb Digital Ventures LLC. Nothing here recommends any asset or transaction, and it does not consider your situation. We are not registered investment advisers. Crypto is highly volatile and you can lose all of your money. Data sources: CoinGecko (prices), Alternative.me (Fear and Greed), CNBC and BLS (CPI), Federal Reserve (FOMC calendar), Farside Investors, farside.co.uk (US spot bitcoin ETF net flows, US$m). Data through Oct 14, 2026.